Thursday 26 November 2015

From the Atlantic to the Arctic to the Antarctic. Plastic is everywhere.


So far all the talk has been about plastic in the Pacific Ocean. However, the problem of plastic in our oceans is actually far more pervasious than this. There are a huge range of studies documenting plastic debris all over the world. Given that plastic 'garbage patches' form due to ocean circulation systems, modelling studies have predicted that there are likely to be other garbage patches. During 1963 km of transects Ryan (2014) recorded 281 litter items between 35-35oS in the southeast Atlantic Ocean, which accords closely wit predictions of surface circulation models. Over 97% of the litter was plastic. In the North Atlantic Ocean Moret-Ferguson et al. (2010) analysed 748 selected samples out of more than 18,000 pieces of plastic debris which had been collected between 1991 and 2007. Using chemical analysis the study found the 3 main types of plastic present were high and low density polyethylene, and polypropylene.
 
World map showing the five great ocean garbage patches
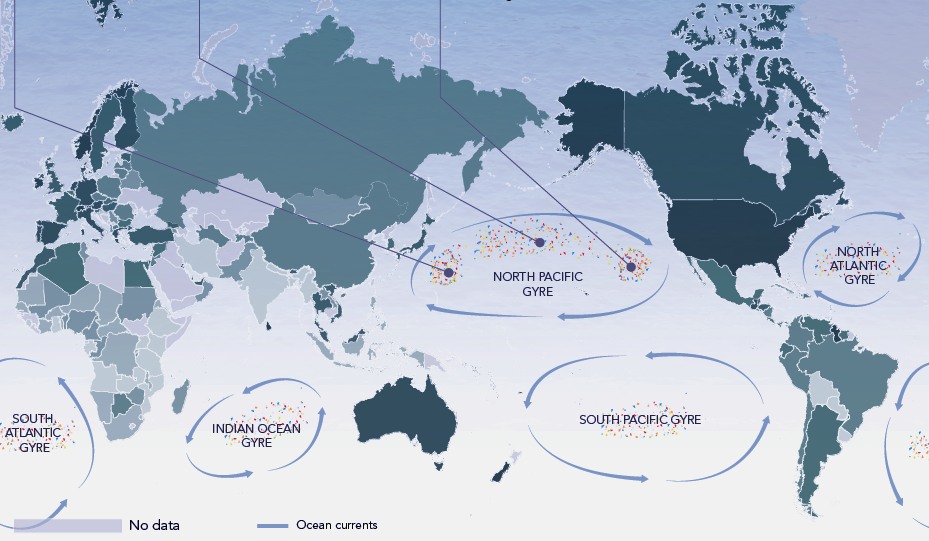
Ocean gyres around the world accumulate plastic. Source.

Unfortunatley, it seems that no region of the oceans are safe from plastic. Even in remote, isolated, and supposedly pristine regions plastic has found its way there. In a 2015 study using observations from ships and helicopters Bergmann et al. found 31 pieces of plastic litter in the Fram Strait and Barents Sea in the Arctic. The surveys carried out covered over 5,500 linear km giving a mean density of 0.0039 plastic items per km-1. Whilst this density may appear neglible, and is substantially lower than in temperate waters e.g. South Atlantic Ocean (0.1030) or the Bay of Bengal (0.2484), the study highlights the reach of plastic debris pollution into even the remotest areas. Furthermore, climate change is likely to compound the problem. As the sea ice shrinks, the Arctic ocean becomes more open to floating debris, and, simultaneously, anthropogenic activities are expanding into the Arctic bringing sources of plastic debris closer.    

Plastic in the Arctic. Source.
Travelling from one pole to the other, plastic has been observed in the Antarctic as well. Eriksson et al. (2013) recorded daily observations of marine debris on two sub-Antarctic islands over a three month period. A staggering 6389 items were collected, of which 94.5% was plastic. Eriksson et al. describe two types of plastic: fresh and exhumed (unburied from the beach). During periods of calm the ratio was usually 1:10, of fresh to exhumed. However, during storm events the ratio shifted to favour fresh plastics suggesting a deep sea reservoir of plastic stirred up by the storm. Barnacle ssp. were found on a range of debris, and were used to infer the origins of the debris. A low rate of barnacle ssp. on a portion of fishing gear suggested that it's from regional trawler fisheries for Antarctic toothfish. Interestingly, the first legal longline fishery for toothfish did not start until 2003, but the authors recorded debris consistent with such a fishery in 2001! Aside from hints about the legality (or not) of previous fisheries in the Antarctic, the paper has an important message about plastic monitoring methods. Using daily collections gave a result of debris items 10 times that which weekly collections estimate. This suggests that debris washes ashore everyday but does not always remain there. Given that studies often use weekly, monthly or even yearly observations of plastic, it is likely that these other estimations are likely to be a gross underestimation of an order of a magnitude or more.   
 
Having covered just a fraction of the studies on the extent of plastic in the oceans, I leave you with the fact below. It really is harrowing just how much plastic we have put into the oceans. More than anything, this is a call for change!
 
Out of 700 sea water samples from all over the world - Indian Ocean, North and South Atlantic, the Sargasso Sea, the Antarctic, South and North Pacific - only 3 samples were plastic-free. - Bill Francis
The extent of plastic in the oceans. Source.

Tuesday 17 November 2015

The politics of the patch... Who will clean it up?

So, we know that garbage patches in our oceans are a big problem. But whose responsibility is it to clean them up? Well, in what is seemingly a classic case of the tragedy of the commons, the oceans are not owned by a single nation state. Nations, therefore, have no individual responsibility for the state of the oceans, and none are keen to claim it as the hypothetical cost of clearing the 'Great Pacific Garbage Patch' is estimated between $122 million and $489 million each year!

This is not to say that nations don't own some of the worlds oceans. By law, every nation with coastline has claim to an 'exclusive economic zone' extending 200 miles from land out to sea, where they can exploit natural resources. However, the garbage patches are in international waters...

Various treaties show the beginnings of a nascent international governance of our oceans, but these are far from effective. Leous and Parry (2005) highlight 3 key international efforts to tackle marine pollution:

  1. London Convention, 1972. Arguably the first modern piece of international marine pollution legislation. This convention aimed to identify and address the sources of marine pollution, and, as part of this effort, established international regulations on the disposal of waste at sea. However, given that 80% of plastic debris is produced on land, the short-comings of the convention are clear.   
  2. UN Convention on the Law of the Sea (UNCLOS), 1982. A significant improvement on the London Convention, recognising the need to protect the oceans as whole, and to address all sources and types of marine pollution. 148 entities have ratified the convention, but implementation and enforcement has proved difficult. 
  3. Washington Declaration on Protection of the Marine Environment from Land-Based Activities, 1995. This declaration has a holistic focus on land-sea interdependence and land-based sources of marine pollution. However, it's major shortcoming is that it is non-binding. The inability to enforce this declaration has made it ineffective.   
International governance of our oceans still has a way to go before it is truly effective. However, whilst no single nation wants to claim responsibility, the fact remains that every single person who consumes plastic has a share of the responsibility. 

Tuesday 10 November 2015

When ocean circulation meets plastic...

As mentioned in the last blog, there is more than one 'garbage patch' in the North Pacific Ocean. The formation of these 'garbage patches' is due to ocean circulation systems, which act to accumulate and retain debris.

Howell et al. (2012) provide an excellent synthesis of ocean circulation interactions with marine debris, which I will be reviewing here. Circulation in the North Pacific Ocean is primarily driven by prevailing winds, which create two major gyres, the cyclonic subpolar and the anticyclonic subtropical. Between the two gyres lies a transition zone. At this boundary of the two frontal systems, the cooler, plankton-rich waters of the subpolar gyre meet the warmer, plankton-poor waters of the subtropical gyre. Therefore, a proxy indicator for this transition zone is the chlorophyll front. As the ocean circulates in these patterns, so too does the plastic within it. The result is 3 observed accumulation zones, which we commonly know as 'garbage patches'. The schematic from Howell et al. below shows the major ocean circulation systems and the garbage patches.   

Figure 1: Schematic of North Pacific ocean circulation and areas of concentrated marine debris. Source: Howell et al., 2012

The two major ocean gyres can be seen demonstrated in the wind stress (A and B) and surface current (C and D) maps below. The transition zone is indicated by the chlorophyll front (E and F).   
Figure 2: Maps of the North Pacific in February and August 2000-2007, showing wind stress fields (A and B), surface currents (C and D), and the transition zone chlorophyll front, a proxy indicator for the North Pacific transition zone (E and F). Source: Howell et al., 2012.
The Eastern Garbage Patch

This is usually what the media is referring to when talking of the Great Pacific Garbage Patch. In this region between Hawaii and California (visible in figure 2 at 130o W, 30o N), the anticyclonic surface currents of the subtropical gyre are at a minimum, meaning that the plastic carried there ends up in a 'dead zone'. The scale of the debris and the region is uncertain, however in 2001 Moore et al. estimated 334,271 pieces of debris per km2.

The Western Garbage Patch

This area near Japan can be seen in the wind stress curl and surface current maps in figure 2 as a tight recirculation gyre at 130o E, 30o N.

The North Pacific Subtropical Convergence Zone

This convergence zone is at the southern edge of the transition zone. Denser waters from the north sink under warmer waters from the south to form a front. The same mechanisms forming the front also leads to an aggregation of organic and inorganic matter. Active organisms can easily overcome the weak vertical flow of water, however buoyant passive matter (i.e. plastic) is more easily retained. Once in the subtropical convergence zone, it's uncertain what happens to the plastic. As a resilient and non-biodegradable material it's likely the plastic remains there for decades.     

Pichel et al. (2007) found that in spring and early summer there is a high density of marine debris in the subtropical convergence zone. Using aerial surveys of areas within the subtropical convergence zone where high concentrations of debris were expected to be found, they observed over 1800 individual pieces of debris (including two large net bundles each over 10m in diameter!). A significant correlation was found between the density of debris and sea-surface temperature, chlorophyll-a, and the gradient of chlorophyll-a. Using this information Pichel et al. developed the Debris Estimated Likelihood Index (DELI), and produced the map below, where pink is the likeliest place to find debris. This map, which is valid only for spring and early summer (due to shifting of the convergence zone), shows high expected concentrations in the subtropical convergence zone above the Hawaiian islands (the grey) compared to surrounding areas. 
Figure 3: Map of Debris Estimated Likelihood Index in the subtropical convergence zone above Hawaii. Source: Pichel et al., 2007
Ocean currents cause plastic accumulates at such a rate, that in samples from the North Pacific Central Gyre near the Eastern Garbage Patch the mass of plastic was approximately 6 times the mass of plankton!