Sunday 20 December 2015

Toxic chemicals make for poisonous plastic

Toxic chemicals are yet another weapon in plastics arsenal, in its apparent bid to destroy marine life (don't get me wrong, this is people's fault, not the plastics). Plastic debris has the potential to act as both a sink and a source for toxic chemicals, transferring them to marine organisms. If that doesn't concern you, the toxic chemicals accumulate up the food chain until they reach our plates. So just remember: what goes in the ocean goes in you.

Toxic chemicals can make their way up the food chain from plastic-ingesting marine species into human diets. Source.

Plastic as a sink for toxic chemicals

Plastic can act as a sink when it adsorbs toxic chemicals in the ambient seawater. These chemicals include persistent, bioaccumulative and toxic substances (PBTs), dichlorodiphenyltrichloroethane (DDT), polychlorinated biphenyls (PCBs), and persistent organic pollutants (POPs). PBTs, DDT, PCBs and POPs present a health concern to humans and the environment. The chemicals can be released into the oceans through pesticides, industrial processes, leaching, or being released from objects into the environment. The interactions between plastic and chemicals in the ocean is complex, but it is more likely than not that PBTs will preferentially sorb to plastic debris, as they have a low water solubility. 

Resin pellets (or nurdles) are the raw material used to make plastics in industry. Mato et al. (2001) studied 4 sites on the Japanese coast, examining PCBs, and DDE (a DDT derivative) in polypropylene resin pellets. The concentrations found in the resin pellets were equivalent to that of the seawater and sediments where they were found. A control experiment measured the absorption of virgin resin pellets, finding a regular and significant increase in PCBs and DDE concentration with exposure to the seawater. Mato et al. (2001) showed that the source of PCBs and DDE in the resin pellets was the ambient seawater, as the pellets absorb the chemicals through a process of enrichment.
Plastic resin pellets act as a sink for toxic chemicals in the ocean. Source.
   
Plastic as a source for toxic chemicals

Plastic act as a source for toxic chemicals due to the compounds added during manufacture to give the plastic certain desirable properties, such as pliability. When the plastic is ingested, the chemicals can leach from the plastic directly into the organism. Here are some examples of the chemicals:
  • Phthalates. Added to PVC for softness and pliability. 
  • Bisphenol A (BPA). A monomer used to make polycarbonate plastics. Can have toxic and biological effects on humans. 
  • Brominated flame retardants. Added to reduce flammability. 
With all the added chemicals, plastic debris has the potential to be a source of toxic chemicals for months or decades.  

In a study of 12 short-tailed shearwaters collected from a research trawler in the North Pacific Ocean, Tanaka et al. (2013) demonstrated that chemicals are not only transferred to the birds from prey but also from ingested plastics. The abdominal fat tissue of the birds was analysed for polybrominated diphenyl ethers (PBDEs), a POP which is added as a flame retardant. 6 lanternfish and 1 squid were also collected and analysed, being common prey for the birds. In 9 of the 12 birds lower-brominated congeners were the dominant form of PBDEs found. The lower-brominated congeners were also dominant in the prey, indicating accumulation through the food chain. However, in the other 3 birds higher-brominated congeners were dominant - this doesn't match the profile of the prey. Plastics can provide the answer here. Higher-brominate congeners are present in plastics, including those found in the stomachs of the 3 birds. The results indicate that ingestion of plastic is the likely source of the higher-brominated congeners.   

Plastic debris acts as both a sink and a source for toxic chemicals. Source.

Interactions between plastic, toxic chemicals and the food chain

There are 3 key terms to know about the interaction between toxic chemicals and the food web:
  1. Bioconcentration. Species living in chemical polluted waters concentrate the chemicals in their tissues
  2. Bioaccumulation. Species face exposure to toxic chemicals from bioconcentration and ingestion. If the exposure is occurring faster than the chemicals can be eliminated, this is bioaccumulation. 
  3. Biomagnification. Chemicals are found in progressively higher concentrations in progressively higher trophic levels in the food chain.
These 3 processes mean that even a small addition of chemicals can lead to large concentrations in species higher up the food chain. That includes humans too. Toxic chemicals and their interactions with plastic debris are a real concern for all people who eat seafood. Plastic is a sink and a source for toxic chemicals, but it is really a vector for transferring toxic chemicals from water, into marine organisms, and into us. Have a think about that next time you eat seafood. 

Biomagnification of toxic chemicals up the food chain. Source

Tuesday 15 December 2015

A second life: ocean plastics re-imagined

Perhaps we can re-imagine the plastic in our oceans. It is still a pollutant, of course, but it could have greater potential. Adidas and Parley for the Oceans have been working on a project which would use 3D printing to turn ocean plastic into trainers. That's right. The plastic in our oceans could even be a resource! Projects like this could transform the lifecycle of plastic, reforming it into something useful again.

Trainers made from ocean plastic. Source: Adidas group. 

Thursday 10 December 2015

Little plastics, big problem: microplastics

Great for washing your face, terrible for marine environments: it's microplastics. They may be little, but they are a massive problem.

Microplastics: admittedly quite pretty, but definitely deadly. Source.
Microplastics (<5mm) have become an increasingly common ingredient in toiletries such as facial cleansers and toothpaste. They are often called 'micro-beads' by the toiletries industry and praised for "exfoliating skin and clearing out pores". The average consumer ends up using microplastics on a daily basis. There's a few reasons why these tiny pieces of plastic are seriously bad news:

  • Microplastics are too small to be caught by wastewater screens, so they go directly into our oceans ...
  • ... but they're plenty small enough to be easily consumed by small marine animals, such as filter feeders, which can starve from satiation, reduced food consumption or intestinal blockages 
  • They then have the potential to pass up the food chain and accumulate
  • Smaller pieces means a bigger surface area, which means more potential for binding and up-taking of toxic contaminants 

They're in our oceans and they're in our rivers too. In a study from earlier this week it was found that the Rhine has the highest levels of microplastic pollution in any recorded river, transporting an unbelievable 191 million plastic particles every single day! Microplastics are bad for you as well our waterways. Microplastics in toothpastes can end up embedding plastic in your gums.... Definitely count me out!

Plastic in my toothpaste? No thanks! Source.
However, not all hope is lost! As consumers, we can all make an effort to avoid products containing microplastics. What's more, major toiletry brands such as L'Oreal and Johnson have made commitments to phase out microplastics and replace them with natural alternatives. Even more encouragingly, laws are beginning to be drawn up which will ban microplastics. Addressing the issue of microplastics rapidly and effectively is a win for ocean conservation!

Tuesday 8 December 2015

Hitching a ride on plastic: alien invasions and the plastisphere

As if directly injuring and killing animals wasn't enough, plastic poses a whole other host of threats to biodiversity and marine ecological systems.

Marine plastic debris is resilient, non-biodegradable and abundant, making it the perfect substrate for species wanting to hitch a ride across the oceans. There are a number of natural substrates which usually fulfil this role, such as wood, feathers and macroalgae. But plastic is outnumbering all the natural substrates and vastly increasing the potential for species transport and dispersal. This enables species to travel further and in greater numbers. Marine plastic is another example of anthropogenic activities causing the spread of invasive species, which have serious consequences for biodiversity.

A wide variety of animals use marine debris as a mode of transportation and dispersal, especially bryozoans, barnacles, polychaete worms and molluscs. In 2002 Barnes studied 30 remote islands across all the worlds oceans, on which over 200 items were found washed ashore. Of these items, anywhere between 20 and 80% were anthropogenic.
Map of study sites, with inset debris on beach. Source: Barnes, 2002.
It was found that the proportion of anthropogenic debris increases with latitude (fig. 2 a). The increase in anthropogenic debris represents an increase in potential for transporting organisms. Figure 2 b shows the effects of remoteness of the island on colonisation of debris. Distance from the mainland is given as  hundreds of kilometres (circles), tens of kilometres (triangles) or less than 10 kilometres (squares). The distance from the mainland doesn't have a significant effect on the proportion of colonised debris. It can also be seen that there were no samples recorded as colonised beyond 60 degrees, most likely due to the persistent low temperatures found at such high latitudes. Global warming will exacerbate the issue, enabling plastic colonisers to travel further poleward. Figure 2 c shows the ratio of colonisation on non-anthropogenic debris to colonisation on anthropogenic debris, with the amount on anthropogenic debris rapidly increasing up to 60 degrees. From this Barnes has concluded that anthropogenic debris in the oceans has approximately doubled the spread of fauna in the sub-tropics, and increased it more than 3 times at latitudes over 50 degrees!

Figure 2: comparison of anthropogenic and colonised debris with latitude. Note: white symbols are in the Northern hemisphere; black symbols are in the Southern hemisphere. Source: Barnes, 2002.

Plastic is doing more than just transporting species: delving down to a much smaller scale we find the 'plastisphere', a new ecological realm. Zettler et al. (2013) carried out an comprehensive study classifying the microbial communities found on polypropylene and polyethylene fragments (used in packaging and single-use plastic items) in the North Atlantic sub-tropical gyre. Using SEM micrographs they found over 50 distinct morphotypes and over 1000 species equivalents of operational taxonomic units.

Figure 2: examples of different morphotypes of bacteria. Source: Zettler et al., 2013.
Their key finding is that the 'plastisphere' microbial communities are distinct from those in surrounding seawater. What this means is that anthropogenic plastic pollution into the oceans has created a novel ecological habitat! I won't go into detailing every single microbe they found, but figure 4 is a bar chart of all different operational taxonomic units, and it is obvious how different the seawater communities are from those found on plastic fragments.

Figure 4: bar chart of different microbial operational taxonomic units illustrating the difference between plastisphere communities and surrounding seawater communities. Source: Zettler et al., 2013.  
Figure 5: Venn diagram illustrating the significant differences between plastisphere communities and surrounding seawater communities. Source: Zettler et al., 2013. 
The Venn diagram shows the disparity between plastisphere communities and seawater communities - there is only a limited overlap. Also, different types of plastic appear to have largely different communities too. What this all means is that we have created a new plastic ecosystem, further evidence for the significant effects of anthropogenic activities on Earth!

Thursday 3 December 2015

Deadly plastic oceans: entanglement and ingestion

One of the most shocking and saddening impacts of marine plastic debris is entanglement of and ingestion by marine species. Entanglement and ingestion is thought to have affected at least 267 different species. The range of species affected is huge including turtles, seabirds, whales and dolphins, penguins, seals and sea lions, sea otters, manatees, fish, and crustaceans. There is a vast amount of literature recording entanglement and ingestion. I have selected a few examples to illustrate how pervasive the problem is.

Entanglement

  • Over a 23 year period Waluda and Staniland (2013) observed 1033 Antarctic fur seals entangled in marine debris at Bird Island, South Georgia. Plastic packaging bands were the most common cause of entanglement (43%), followed by synthetic fishing line (25%) and fishing net (17%). 44% of seals entanglement were juvenile males - who will have a lot of growing left to do. 
  • Page et al. (2004) estimate that 1478 seals die from entanglement each year in Australia alone. Studying Australian sea lions and New Zealand fur seals at Kangaroo Island, Australia, Page et al. found that the rate of entanglement had not decreased in recent years, despite government and fishing industry efforts aimed to reduce the impact of fishing activities on non-target species. When lost or abandoned fishing gear 'catches' seals, fish or other species, this is known as 'ghost fishing' (Gregory, 2009). Australian sea lions and New Zealand fur seals have the 3rd and 4th highest entanglement rates for any seal species. 
  • A northern gannet colony in Wales was studied for two weeks in October from 1996-1997 and 2005-2010. Votier et al. (2011) looked at 6 nests representative of the overall colony (in terms of individual nest size), and calculated that the average nest contained 469.91g of plastic, predominantly synthetic rope. The estimated colony total was 18.46 tonnes of plastic. On average this led to 63 birds entangled each year, or 525 individuals over the 8 study years. Votier et al. believe that this level of entanglement is unlikely to have population-level effects.
  • Sightings of pods of endangered humpback whales showed at least 7 whales towing tangled rope or other debris (Gregory, 2009)
  • Sharks are often entangled in 'debris collars' (Gregory, 2009)
Cartoon entanglement, from Happy Feet. Source.
Ingestion

  • Several sea turtle species are seriously endangered from ingestion of plastic debris. Turtles often mistake floating plastic bags for jellyfish (Gregory, 2009). Analysing the stomach and oesophagus content of sea turtles in Southern Brazil, Bugoni et al. (2001) found that plastic bags were the most common form of debris ingestion, predominantly clear or white pieces, i.e. those most resembling jellyfish. 13.2% of green turtle deaths were accountable to the ingestion of anthropogenic debris. 
  • There are over 100 species of bird known to ingest plastic (Gregory, 2009). These birds include albatrosses, of which Jimenez et al. (2015) studied 128 specimens of 7 different species. The amount of plastic fragments ingested varied significantly between species, indicating a difference in feeding and foraging patterns. Only 2% of mollymawk albatross (Thalassarche spp.) had ingested plastic, whereas 25.6% of great albatross (Diomedea spp.) had ingested plastic, with the highest being Diomedea sanford at 38.9%! 
  • In the first study to examine plastic ingestion in common planktivorous fish, Boerger et al. (2010) found that approximately 35% of fish collected from surface waters of the North Pacific Central Gyre had ingested plastic, averaging 2.1 pieces of plastic per fish.
From these few examples it clear just how deadly the oceans have become for marine species, due to the anthropogenic input of plastic debris.


Thursday 26 November 2015

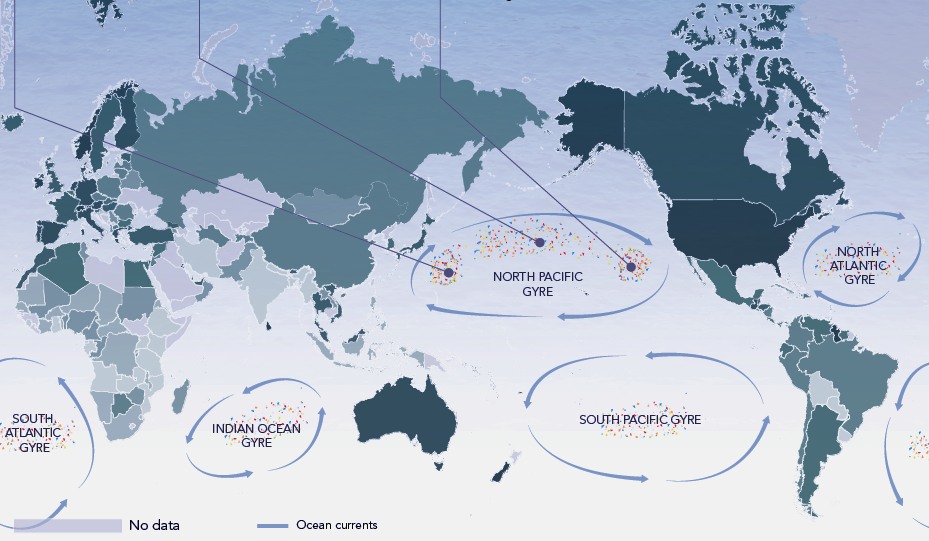
From the Atlantic to the Arctic to the Antarctic. Plastic is everywhere.


So far all the talk has been about plastic in the Pacific Ocean. However, the problem of plastic in our oceans is actually far more pervasious than this. There are a huge range of studies documenting plastic debris all over the world. Given that plastic 'garbage patches' form due to ocean circulation systems, modelling studies have predicted that there are likely to be other garbage patches. During 1963 km of transects Ryan (2014) recorded 281 litter items between 35-35oS in the southeast Atlantic Ocean, which accords closely wit predictions of surface circulation models. Over 97% of the litter was plastic. In the North Atlantic Ocean Moret-Ferguson et al. (2010) analysed 748 selected samples out of more than 18,000 pieces of plastic debris which had been collected between 1991 and 2007. Using chemical analysis the study found the 3 main types of plastic present were high and low density polyethylene, and polypropylene.
 
World map showing the five great ocean garbage patches
Ocean gyres around the world accumulate plastic. Source.

Unfortunatley, it seems that no region of the oceans are safe from plastic. Even in remote, isolated, and supposedly pristine regions plastic has found its way there. In a 2015 study using observations from ships and helicopters Bergmann et al. found 31 pieces of plastic litter in the Fram Strait and Barents Sea in the Arctic. The surveys carried out covered over 5,500 linear km giving a mean density of 0.0039 plastic items per km-1. Whilst this density may appear neglible, and is substantially lower than in temperate waters e.g. South Atlantic Ocean (0.1030) or the Bay of Bengal (0.2484), the study highlights the reach of plastic debris pollution into even the remotest areas. Furthermore, climate change is likely to compound the problem. As the sea ice shrinks, the Arctic ocean becomes more open to floating debris, and, simultaneously, anthropogenic activities are expanding into the Arctic bringing sources of plastic debris closer.    

Plastic in the Arctic. Source.
Travelling from one pole to the other, plastic has been observed in the Antarctic as well. Eriksson et al. (2013) recorded daily observations of marine debris on two sub-Antarctic islands over a three month period. A staggering 6389 items were collected, of which 94.5% was plastic. Eriksson et al. describe two types of plastic: fresh and exhumed (unburied from the beach). During periods of calm the ratio was usually 1:10, of fresh to exhumed. However, during storm events the ratio shifted to favour fresh plastics suggesting a deep sea reservoir of plastic stirred up by the storm. Barnacle ssp. were found on a range of debris, and were used to infer the origins of the debris. A low rate of barnacle ssp. on a portion of fishing gear suggested that it's from regional trawler fisheries for Antarctic toothfish. Interestingly, the first legal longline fishery for toothfish did not start until 2003, but the authors recorded debris consistent with such a fishery in 2001! Aside from hints about the legality (or not) of previous fisheries in the Antarctic, the paper has an important message about plastic monitoring methods. Using daily collections gave a result of debris items 10 times that which weekly collections estimate. This suggests that debris washes ashore everyday but does not always remain there. Given that studies often use weekly, monthly or even yearly observations of plastic, it is likely that these other estimations are likely to be a gross underestimation of an order of a magnitude or more.   
 
Having covered just a fraction of the studies on the extent of plastic in the oceans, I leave you with the fact below. It really is harrowing just how much plastic we have put into the oceans. More than anything, this is a call for change!
 
Out of 700 sea water samples from all over the world - Indian Ocean, North and South Atlantic, the Sargasso Sea, the Antarctic, South and North Pacific - only 3 samples were plastic-free. - Bill Francis
The extent of plastic in the oceans. Source.

Tuesday 17 November 2015

The politics of the patch... Who will clean it up?

So, we know that garbage patches in our oceans are a big problem. But whose responsibility is it to clean them up? Well, in what is seemingly a classic case of the tragedy of the commons, the oceans are not owned by a single nation state. Nations, therefore, have no individual responsibility for the state of the oceans, and none are keen to claim it as the hypothetical cost of clearing the 'Great Pacific Garbage Patch' is estimated between $122 million and $489 million each year!

This is not to say that nations don't own some of the worlds oceans. By law, every nation with coastline has claim to an 'exclusive economic zone' extending 200 miles from land out to sea, where they can exploit natural resources. However, the garbage patches are in international waters...

Various treaties show the beginnings of a nascent international governance of our oceans, but these are far from effective. Leous and Parry (2005) highlight 3 key international efforts to tackle marine pollution:

  1. London Convention, 1972. Arguably the first modern piece of international marine pollution legislation. This convention aimed to identify and address the sources of marine pollution, and, as part of this effort, established international regulations on the disposal of waste at sea. However, given that 80% of plastic debris is produced on land, the short-comings of the convention are clear.   
  2. UN Convention on the Law of the Sea (UNCLOS), 1982. A significant improvement on the London Convention, recognising the need to protect the oceans as whole, and to address all sources and types of marine pollution. 148 entities have ratified the convention, but implementation and enforcement has proved difficult. 
  3. Washington Declaration on Protection of the Marine Environment from Land-Based Activities, 1995. This declaration has a holistic focus on land-sea interdependence and land-based sources of marine pollution. However, it's major shortcoming is that it is non-binding. The inability to enforce this declaration has made it ineffective.   
International governance of our oceans still has a way to go before it is truly effective. However, whilst no single nation wants to claim responsibility, the fact remains that every single person who consumes plastic has a share of the responsibility. 

Tuesday 10 November 2015

When ocean circulation meets plastic...

As mentioned in the last blog, there is more than one 'garbage patch' in the North Pacific Ocean. The formation of these 'garbage patches' is due to ocean circulation systems, which act to accumulate and retain debris.

Howell et al. (2012) provide an excellent synthesis of ocean circulation interactions with marine debris, which I will be reviewing here. Circulation in the North Pacific Ocean is primarily driven by prevailing winds, which create two major gyres, the cyclonic subpolar and the anticyclonic subtropical. Between the two gyres lies a transition zone. At this boundary of the two frontal systems, the cooler, plankton-rich waters of the subpolar gyre meet the warmer, plankton-poor waters of the subtropical gyre. Therefore, a proxy indicator for this transition zone is the chlorophyll front. As the ocean circulates in these patterns, so too does the plastic within it. The result is 3 observed accumulation zones, which we commonly know as 'garbage patches'. The schematic from Howell et al. below shows the major ocean circulation systems and the garbage patches.   

Figure 1: Schematic of North Pacific ocean circulation and areas of concentrated marine debris. Source: Howell et al., 2012

The two major ocean gyres can be seen demonstrated in the wind stress (A and B) and surface current (C and D) maps below. The transition zone is indicated by the chlorophyll front (E and F).   
Figure 2: Maps of the North Pacific in February and August 2000-2007, showing wind stress fields (A and B), surface currents (C and D), and the transition zone chlorophyll front, a proxy indicator for the North Pacific transition zone (E and F). Source: Howell et al., 2012.
The Eastern Garbage Patch

This is usually what the media is referring to when talking of the Great Pacific Garbage Patch. In this region between Hawaii and California (visible in figure 2 at 130o W, 30o N), the anticyclonic surface currents of the subtropical gyre are at a minimum, meaning that the plastic carried there ends up in a 'dead zone'. The scale of the debris and the region is uncertain, however in 2001 Moore et al. estimated 334,271 pieces of debris per km2.

The Western Garbage Patch

This area near Japan can be seen in the wind stress curl and surface current maps in figure 2 as a tight recirculation gyre at 130o E, 30o N.

The North Pacific Subtropical Convergence Zone

This convergence zone is at the southern edge of the transition zone. Denser waters from the north sink under warmer waters from the south to form a front. The same mechanisms forming the front also leads to an aggregation of organic and inorganic matter. Active organisms can easily overcome the weak vertical flow of water, however buoyant passive matter (i.e. plastic) is more easily retained. Once in the subtropical convergence zone, it's uncertain what happens to the plastic. As a resilient and non-biodegradable material it's likely the plastic remains there for decades.     

Pichel et al. (2007) found that in spring and early summer there is a high density of marine debris in the subtropical convergence zone. Using aerial surveys of areas within the subtropical convergence zone where high concentrations of debris were expected to be found, they observed over 1800 individual pieces of debris (including two large net bundles each over 10m in diameter!). A significant correlation was found between the density of debris and sea-surface temperature, chlorophyll-a, and the gradient of chlorophyll-a. Using this information Pichel et al. developed the Debris Estimated Likelihood Index (DELI), and produced the map below, where pink is the likeliest place to find debris. This map, which is valid only for spring and early summer (due to shifting of the convergence zone), shows high expected concentrations in the subtropical convergence zone above the Hawaiian islands (the grey) compared to surrounding areas. 
Figure 3: Map of Debris Estimated Likelihood Index in the subtropical convergence zone above Hawaii. Source: Pichel et al., 2007
Ocean currents cause plastic accumulates at such a rate, that in samples from the North Pacific Central Gyre near the Eastern Garbage Patch the mass of plastic was approximately 6 times the mass of plankton!

Wednesday 28 October 2015

The Great Pacific Garbage Patch

In the next few blog posts I'm going to be discussing the 'Great Pacific Garbage Patch', one of the most popular topics in marine plastics. It refers to a mass of marine plastic and other debris in the North Pacific Ocean, brought together by ocean gyres. The Garbage Patch is often seized upon by the media (see articles in The Telegraph, The Guardian, and The Daily Mail) in order to convey the sheer size of the marine plastic problem to the public, however, it is rather misunderstood.

So, before exploring the science and the politics behind the patch, let's cover the basics. 

There is no such thing as the Great Pacific Garbage Patch. 

Whilst a popular idea, the Great Pacific Garbage Patch as most people imagine it simply does not exist. The name in itself leads to a common misconception about the nature of the Garbage Patch: that it is a singular and solid mass of plastic.

Firstly, there is more than one Garbage Patch. There are actually Western and Eastern Pacific Garbage Patches, and another important area called the subtropical convergence zone.   

Multiple Garbage Patches (Source: NOAA)

Secondly, there isn't an island of plastic. This is because most of the plastic debris is very small, and doesn't form a solid mass, but rather floats around in an unpleasant plastic-y soup.
(Check out this poster by NOAA for more info on the Great Pacific Garbage Patch)   

Having got that out the way, the next blogs will look in more detail at the interactions between ocean circulation and plastic debris, and, a very interesting question, 'whose responsibility is it to clear the Garbage Patches?'.  

Thursday 15 October 2015

Welcome!

Hello and welcome!


In this blog I am going to be exploring the impacts of plastic debris on marine life and ecosystems. I'll be taking a look at where the plastic is coming from, how it is affecting our oceans globally, and what the possible solutions are to the problem. First, let's examine why marine plastics present a global issue.

Why are marine plastics a global issue?


Marine plastic or plastic debris refer to the plastic rubbish in our oceans. This plastic poses two primary threats to marine life: entanglement and ingestion. Entanglement is when a part of an animal becomes trapped in a piece of plastic, often resulting in restricted development of the animal as it grows, and cannot break the plastic. Ingestion can occur when an animal mistakes plastic for prey or food. Ingestion can lead to starvation as the animals' stomach becomes full of plastic. These problems are pervasive across a number of species. The United Nations Environment Programme (UNEP) estimates that at least 267 different species have experienced entanglement or ingestion.

Entanglement. (Source: http://www.ourendangeredworld.com/plastic-pollution)

Ingestion. (Source: http://www.oceanhealthindex.org/news/Death_By_Plastic)

The scale of plastic debris in the oceans is not fully known. However, marine plastic is found globally, in every ocean from the poles to the equator. The quantity of marine plastic can only be estimated, but UNEP studies suggest the figure in 2005/2006 was between 13,000 and 18,000 pieces of plastic rubbish in every square kilometre of ocean. Whilst there is no consensus on the exact amount of plastic debris in our oceans, it is clear that the problem is vast.